森林图 (forestplot包)
在Meta分析中森林图比较常见,但其实掌握了用R语言中的forestplot包绘制森林图的各个用法,森林图可以用于表示其他数据类型各组间的指标的中值和四分位距的范围。它是在平面直角坐标系中,以一条垂直的无效线(横坐标刻度为1或0)为中心,平行于横轴的多条线段描述了每个组的指标的中值和可信区间,最后一行(Summary)则用棱形(或其它图形)描述了多个组别合并的效应量及可信区间。
首先安装forestplot 包:
install.packages("forestplot")
主函数 forestplot :
用法:
forestplot(labeltext, mean, lower, upper, align, is.summary = FALSE, graph.pos = "right", hrzl_lines, clip = c(-Inf, Inf), xlab = "", zero = ifelse(xlog, 1, 0), graphwidth = "auto", colgap, lineheight = "auto", line.margin, col = fpColors(), txt_gp = fpTxtGp(), xlog = FALSE, xticks, xticks.digits = 2, grid = FALSE, lwd.xaxis, lwd.zero, lwd.ci, lty.ci = 1, ci.vertices, ci.vertices.height = 0.1, boxsize, mar = unit(rep(5, times = 4), "mm"), title, legend, legend_args = fpLegend(), new_page = getOption("forestplot_new_page", TRUE), fn.ci_norm = fpDrawNormalCI, fn.ci_sum = fpDrawSummaryCI, fn.legend, ...)
参数:这里只列出了大部分参数,还有一些比较不常用的可以自行探索
labeltext主要是以矩阵或者list形式将数据导入函数,最好以矩阵,因为数据一般都是矩阵的。mean误差条的均值lower误差条 95%置信区间下限upper误差条 95%置信区间上限align每列文字的对齐方式,偶尔会用到。如:align=c("l","c","c")l:左对齐r:右对齐c:居中对齐is.summary主要的功能是让表格的每一行字体出现差异,从而区分表头。其值主要用TRUE/FALSE进行差异化分配。graph.pos定位森林图所在的位置。通过数字来确定为第几列。hrzl_lines以list形式设置表中线条的类型、影响范围。Eg:“3”=gpar(lwd=1,columns=1:4,col=’red’)意思就是第3行的线条,宽度为1,线段延伸至第四列。Col指的颜色。clipx轴的最大最小范围xlabx轴的标题zero森林图中基准线的位置(无效线的横坐标)graphwidth森林图在表中的宽度如:graphwidth = unit(.4,"npc")colgap
列与列之间的间隙宽度,默认是 6 mm,需要用 unit 的形式
lineheight行的高度,可以是数字,也可以是 unit 的形式line.margin行与行之间的间隙的宽度col森林图横线以及点的颜色。box:box(点估计值)的颜色line:穿过方块的横线的颜色zero:中间那条基准线的颜色summary:summary中菱形的颜色hrz_lines:表中第一条横线的颜色eg:col=fpcolors(box=’royblue’,line=’darkblue’, summary=’royblue’, hrz_lines=’red’)txt_gp设置表格中文本的格式:用gpar进行赋值,其中cex为文本字体大小,ticks为坐标轴大小,xlab为坐标轴文字字体大小。label:表格主体文字的格式ticks:森林图下方的坐标轴的刻度文字格式xlab:定义的x轴标题格式title:标题文字的格式eg:txt_gp=fpTxtGp(label=gpar(cex=1.25), ticks=gpar(cex=1.1), xlab=gpar(cex = 1.2), title=gpar(cex = 1.2))xticks横坐标刻度根据需要可随意设置,如:xticks = c(0.5, 1,1.5, 2)lwd.xaxisX轴线宽lwd.zero无效线的宽度lwd.ci置信区间线条的宽度(粗细)lty.ci置信区间的线条类型ci.vertices森林图可信区间两端添加小竖线(TRUE)ci.vertices.height设置森林图可信区间两端的小竖线高度,默认是10%行高boxsizebox(点估计值)的大小mar图形页边距,如:mar=unit(rep(1.25, times = 4), "cm")title添加标题legend当同时显示多个置信区间时,需要添加图例
new_page
是否新页fn.ci_normbox(点估计值)的形状,默认是方块。如:fn.ci_norm="fpDrawDiamondCI":box 类型选择钻石
示例代码①:先从构建的最简单的数据开始
# 构建示例数据
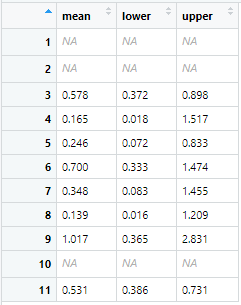
library(forestplot)# Cochrane data from the 'rmeta'-packagecochrane_from_rmeta <- structure(list( mean =c(NA, NA, 0.578, 0.165, 0.246, 0.700, 0.348, 0.139, 1.017, NA, 0.531), lower =c(NA, NA, 0.372, 0.018, 0.072, 0.333, 0.083, 0.016, 0.365, NA, 0.386), upper =c(NA, NA, 0.898, 1.517, 0.833, 1.474, 1.455, 1.209, 2.831, NA, 0.731)), .Names =c("mean", "lower", "upper"), row.names =c(NA, -11L), class ="data.frame")

tabletext<-cbind(c("", "Study", "Auckland", "Block","Doran", "Gamsu", "Morrison", "Papageorgiou","Tauesch", NA, "Summary"),c("Deaths", "(steroid)", "36", "1","4", "14", "3", "1","8", NA, NA),c("Deaths", "(placebo)", "60", "5","11", "20", "7", "7","10", NA, NA),c("", "OR", "0.58", "0.16","0.25", "0.70", "0.35", "0.14","1.02", NA, "0.53"))

以下使用 forestplot 函数画森林图,注意查看每个代码发生变化的参数以及对应图片中明显变化的地方。
forestplot(tabletext, graph.pos =4, hrzl_lines =list("3"=gpar(lty=2), "11" =gpar(lwd=1, columns=c(1:3,5), col ="#000044"), "12" =gpar(lwd=1, lty=2, columns=c(1:3,5), col ="#000044")), cochrane_from_rmeta,new_page =TRUE, is.summary=c(TRUE,TRUE,rep(FALSE,8),TRUE), clip=c(0.1,2.5), xlog=TRUE, col=fpColors(box="royalblue",line="darkblue",summary="royalblue",hrz_lines ="#444444"))

forestplot(tabletext, graph.pos =4, hrzl_lines =list("3"=gpar(lty=2,col ="red"), "11" =gpar(lwd=1, columns=c(1:3,5), col ="#000044"), "12" =gpar(lwd=1, lty=2, columns=c(1:3,5), col ="#000044")), cochrane_from_rmeta,new_page =TRUE, is.summary=c(TRUE,TRUE,rep(FALSE,8),TRUE), clip=c(0.1,2.5), xlog=TRUE, col=fpColors(box="royalblue",line="darkblue",summary="royalblue",hrz_lines ="#444444"))

forestplot(tabletext, graph.pos =4, hrzl_lines =list("3"=gpar(lty=2), "11" =gpar(lwd=1, columns=c(1:3,5), col ="red"), "12" =gpar(lwd=1, lty=2, columns=c(1:3,5), col ="#000044")), cochrane_from_rmeta,new_page =TRUE, is.summary=c(TRUE,TRUE,rep(FALSE,8),TRUE), clip=c(0.1,2.5), xlog=TRUE, col=fpColors(box="royalblue",line="darkblue",summary="royalblue",hrz_lines ="#444444"))

forestplot(tabletext, graph.pos =4, hrzl_lines =list("3"=gpar(lty=2), "11" =gpar(lwd=1, columns=c(1:3,5), col ="#000044"), "12" =gpar(lwd=1, lty=2, columns=c(1:3,5), col ="red")), cochrane_from_rmeta,new_page =TRUE, is.summary=c(TRUE,TRUE,rep(FALSE,8),TRUE), clip=c(0.1,2.5), xlog=TRUE, col=fpColors(box="royalblue",line="darkblue",summary="royalblue",hrz_lines ="#444444"))

forestplot(tabletext, graph.pos =4, hrzl_lines =list("3"=gpar(lty=2), "11" =gpar(lwd=1, columns=c(1:3,5), col ="#000044"), "12" =gpar(lwd=1, lty=2, columns=c(1:3,5), col ="#000044")), cochrane_from_rmeta,new_page =TRUE, is.summary=c(TRUE,TRUE,rep(FALSE,8),TRUE), clip=c(0.1,2.5), xlog=TRUE, col=fpColors(box="red",line="darkblue",summary="royalblue",hrz_lines ="#444444"))

forestplot(tabletext, graph.pos =4, hrzl_lines =list("3"=gpar(lty=2), "11" =gpar(lwd=1, columns=c(1:3,5), col ="#000044"), "12" =gpar(lwd=1, lty=2, columns=c(1:3,5), col ="#000044")), cochrane_from_rmeta,new_page =TRUE, is.summary=c(TRUE,TRUE,rep(FALSE,8),TRUE), clip=c(0.1,2.5), xlog=TRUE, col=fpColors(box="royalblue",line="red",summary="royalblue",hrz_lines ="#444444"))

forestplot(tabletext, graph.pos =4, hrzl_lines =list("3"=gpar(lty=2), "11" =gpar(lwd=1, columns=c(1:3,5), col ="#000044"), "12" =gpar(lwd=1, lty=2, columns=c(1:3,5), col ="#000044")), cochrane_from_rmeta,new_page =TRUE, is.summary=c(TRUE,TRUE,rep(FALSE,8),TRUE), clip=c(0.1,2.5), xlog=TRUE, col=fpColors(box="royalblue",line="darkblue",summary="red",hrz_lines ="#444444"))

forestplot(tabletext, graph.pos =4, hrzl_lines =list("3"=gpar(lty=2), "11" =gpar(lwd=1, columns=c(1:3,5), col ="#000044"), "12" =gpar(lwd=1, lty=2, columns=c(1:3,5), col ="#000044")), cochrane_from_rmeta,new_page =TRUE, is.summary=c(TRUE,TRUE,rep(FALSE,8),TRUE), clip=c(0.1,2.5), xlog=TRUE, col=fpColors(box="royalblue",line="darkblue",summary="royalblue",hrz_lines ="red"))

# 添加标题forestplot(tabletext, graph.pos =4, title="Hazard Ratio", hrzl_lines =list("3"=gpar(lty=2), "11" =gpar(lwd=1, columns=c(1:3,5), col ="#000044"), "12" =gpar(lwd=1, lty=2, columns=c(1:3,5), col ="#000044")), cochrane_from_rmeta,new_page =TRUE, is.summary=c(TRUE,TRUE,rep(FALSE,8),TRUE), clip=c(0.1,2.5), xlog=TRUE, col=fpColors(box="royalblue",line="darkblue",summary="royalblue",hrz_lines ="#444444"))

# 定义x轴forestplot(tabletext, graph.pos =4, title="Hazard Ratio", hrzl_lines =list("3"=gpar(lty=2), "11" =gpar(lwd=1, columns=c(1:3,5), col ="#000044"), "12" =gpar(lwd=1, lty=2, columns=c(1:3,5), col ="#000044")), cochrane_from_rmeta,new_page =TRUE, is.summary=c(TRUE,TRUE,rep(FALSE,8),TRUE), xlab=" <---PCI Better--- ---Medical Therapy Better--->", clip=c(0.1,2.5), xlog=TRUE, col=fpColors(box="royalblue",line="darkblue",summary="royalblue",hrz_lines ="#444444"))

# 取消对头2行和最后1行字体的特殊设置forestplot(tabletext, graph.pos =4, title="Hazard Ratio", hrzl_lines =list("3"=gpar(lty=2), "11" =gpar(lwd=1, columns=c(1:3,5), col ="#000044"), "12" =gpar(lwd=1, lty=2, columns=c(1:3,5), col ="#000044")), cochrane_from_rmeta,new_page =TRUE, is.summary=c(rep(FALSE,11)), xlab=" <---PCI Better--- ---Medical Therapy Better--->", clip=c(0.1,2.5), xlog=TRUE, zero=1, col=fpColors(box="royalblue",line="darkblue",summary="royalblue",hrz_lines ="#444444"))

示例代码②:需要定义亚组的数据
### 准备数据
library(forestplot)#数据来源:https://www.r-bloggers.com/forest-plot-with-horizontal-bands/data <- read.csv("forestplotdata.csv", stringsAsFactors=FALSE)
head(data)# Variable Count Percent Point.Estimate Low High PCI.Group Medical.Therapy.Group P.Value# 1 Overall 2166 100 1.3 0.90 1.50 17.2 15.6 NA# 2 NA NA NA NA NA NA NA NA# 3 Age NA NA NA NA NA NA NA 0.05# 4 <= 65 1534 71 1.5 1.05 1.90 17.0 13.2 NA# 5 > 65 632 29 0.8 0.60 1.25 17.8 21.3 NA# 6 NA NA NA NA NA NA NA NA
### 绘制森林图
## 简单森林图
# 构建tabletext,更改列名称,将 count 和 percent 合并np <- ifelse(!is.na(data$Count), paste(data$Count," (",data$Percent,")",sep=""), NA)View(np)

# 写出将要在图中展现出来的文本tabletext <- cbind(c("Subgroup","",data$Variable), c("No. of Patients (%)","",np), c("4-Yr Cum. Event Rate PCI","",data$PCI.Group), c("4-Yr Cum. Event Rate Medical Therapy","",data$Medical.Therapy.Group), c("P Value","",data$P.Value)View(tabletext)

##绘制森林图forestplot(labeltext=tabletext, graph.pos=3, mean=c(NA,NA,data$Point.Estimate), lower=c(NA,NA,data$Low), upper=c(NA,NA,data$High), boxsize=0.5)

接下来要对森林图进行优化:
## 定义亚组subgps <- c(4,5,8,9,12,13,16,17,20,21,24,25,28,29,32,33)data$Variable[subgps] <- paste(" ",data$Variable[subgps])View(data)

png(filename = "Forestplot.png",width=960, height=640)forestplot(labeltext=tabletext, graph.pos=3, #为Pvalue箱线图所在的位置 mean=c(NA,NA,data$Point.Estimate), lower=c(NA,NA,data$Low), upper=c(NA,NA,data$High), title="Hazard Ratio Plot", #定义标题 xlab=" <---PCI Better--- ---Medical Therapy Better--->", #定义x轴 ##根据亚组的位置,设置线型,宽度造成“区块感” hrzl_lines=list("3" = gpar(lwd=1, col="black"), "7" = gpar(lwd=60, lineend="butt", columns=c(2:6), col="#99999922"), "15" = gpar(lwd=60, lineend="butt", columns=c(2:6), col="#99999922"), "23" = gpar(lwd=60, lineend="butt", columns=c(2:6), col="#99999922"), "31" = gpar(lwd=60, lineend="butt", columns=c(2:6), col="#99999922")), #fpTxtGp函数中的cex参数设置各部分字体大小 txt_gp=fpTxtGp(label=gpar(cex=1.25), ticks=gpar(cex=1.1), xlab=gpar(cex = 1.2), title=gpar(cex = 1.2)), col=fpColors(box="#1c61b6", lines="#1c61b6", zero = "gray50"), ##fpColors函数设置颜色 zero=1, #箱线图中基准线的位置 cex=0.9, lineheight = "auto", colgap=unit(8,"mm"), lwd.ci=2, boxsize=0.5, #箱子大小,线的宽度 ci.vertices=TRUE, ci.vertices.height = 0.4) #森林图可信区间两端添加小竖线,设置高度dev.off()

森林图怎么看:
(1)森林图中横短线与中线相交表示无统计学意义;
(2)95% CI上下限均>1,即在森林图中,其95% CI横线不与无效竖线相交,且该横线落在无效线右侧时,说明该指标大于竖线代表的结局;
(3)95% CI上下限均<1,即在森林图中,其95% CI横线不与无效竖线相交,且该横线落在无效线左侧时,说明该指标小于于竖线代表的结局。
(4)最后以菱形所在位置代表总体的评价结果。具体数据具体分析哈!

图片新闻
技术文库
最新活动更多
-
4月23日立即报名>> 【在线会议】研华嵌入式核心优势,以Edge AI驱动机器视觉升级
-
4月25日立即报名>> 【线下论坛】新唐科技2025新品发布会
-
7.30-8.1火热报名中>> 全数会2025(第六届)机器人及智能工厂展
-
7月30-31日报名参会>>> 全数会2025中国激光产业高质量发展峰会
-
精彩回顾立即查看>> OFweek 2025(第十四届)中国机器人产业大会
-
精彩回顾立即查看>> 【在线会议】从直流到高频,材料电特性参数的全面表征与测量


 分享
分享


发表评论
请输入评论内容...
请输入评论/评论长度6~500个字
暂无评论
暂无评论